


Your Dog in Data
A bad, doggy-centric intro to urban data.


Last week I woke up at an ungodly hour to have a call with a client in Berlin. Afterward, I considered going back to sleep but figured I should start the day and decided a walk to Fort Greene Park would jolt me awake. I arrived before 8 am during prime dog-walking hours. I love dogs, but the ungodly amount of peeing, pooping, humping, and fur-flying antics gave even me pause. I thought of the lawn wear and tear, and the human picnickers who would arrive later in the day to frolic in what is essentially a giant litter box.
But my biggest takeaway was the diversity of breeds. When I was new to London, I found it helpful to look at the dogs on the street to get a sense of what kind of place I was in. One day I biked several miles from Brixton into Barnes. My first indication of the Barnes vibe was seeing two Cocker Spaniels running around with a Corgi and a King Charles in a little patch of green. Sure enough, as I penetrated deeper it was clear that I had entered an incredibly posh little corner of West London that could easily be a catalog shoot for Barbour and Landrover. I wondered if NYC neighborhoods could be similarly stereotyped based on their dogs. Luckily, there’s a way to find out.
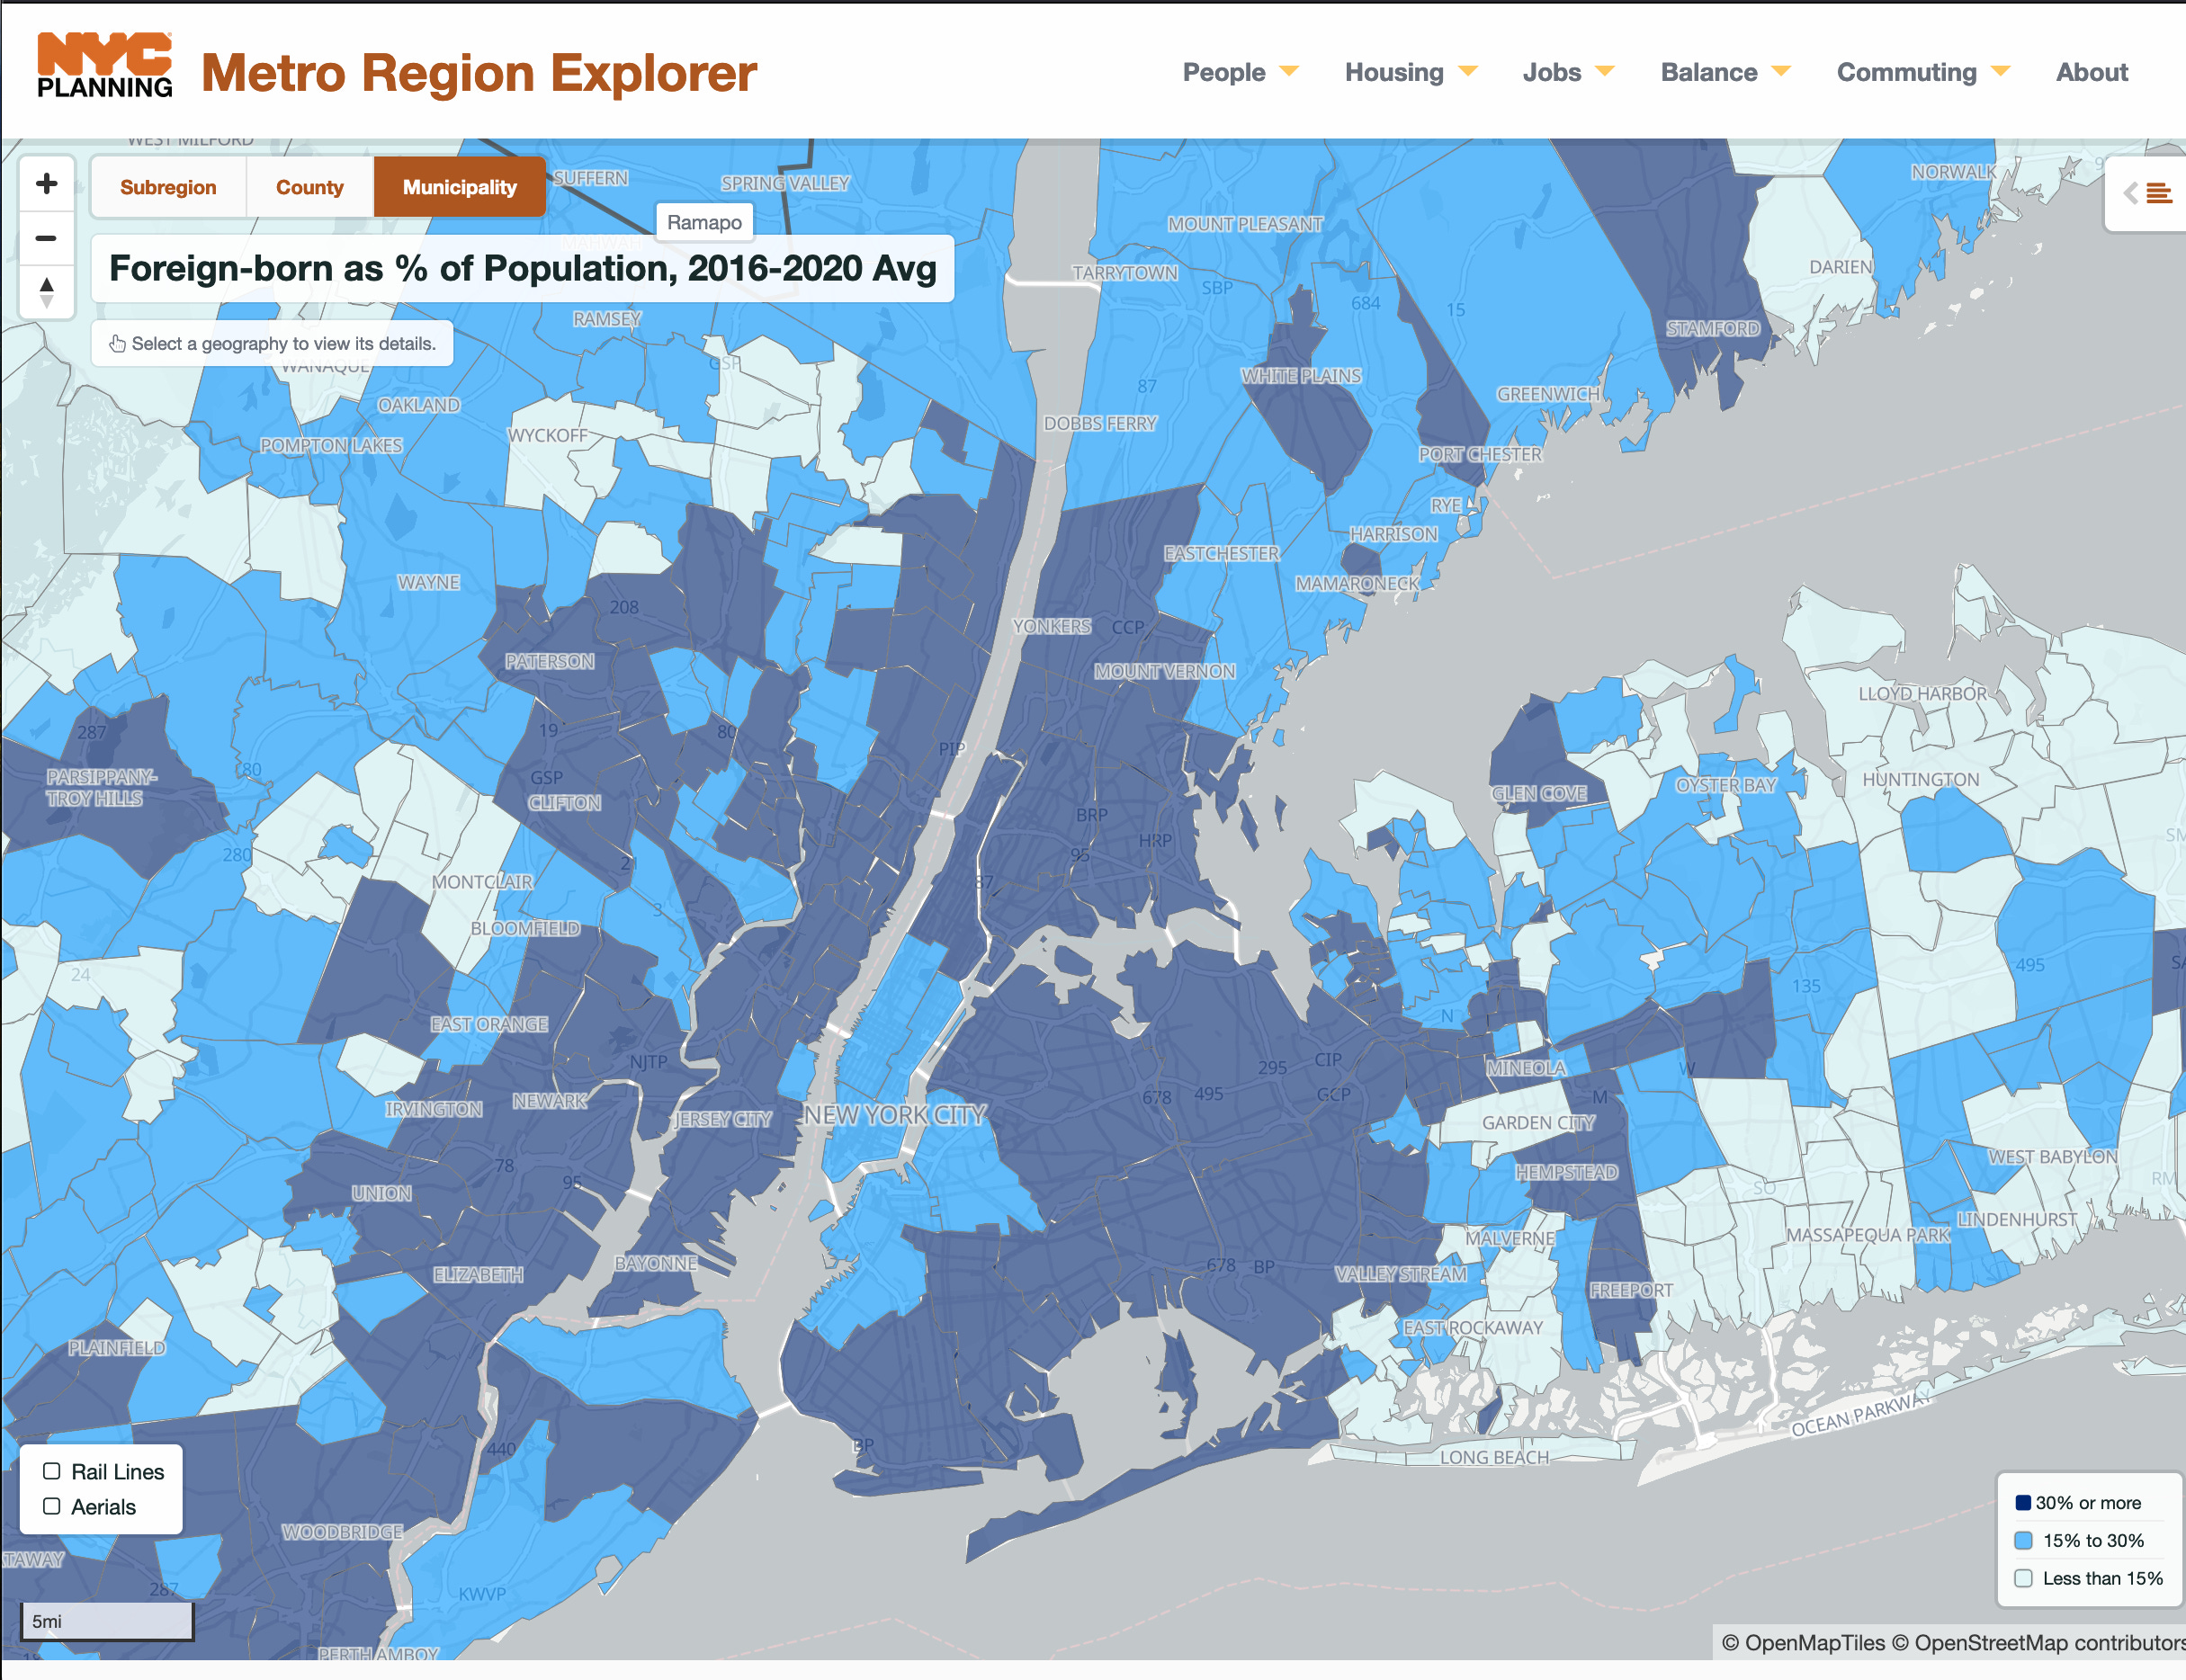
Believe it or not, NYC does count its dogs. Dogs are required to be licensed at the time of adoption/sale at which point some basic information is logged in a city database, breed, name, zip code, etc. This info is available to the public through the city’s Open Data portal, a repository of the vast amounts of information the city collects. Here, you can download spreadsheets and maps of everything from tree locations to subway entrances to the read-outs of various temperature monitors the government has placed throughout the city. Most of this data is in formats requiring software skills in Excel or map-making software like QGIS and programming languages like R and Python. The city also uses its data store to spin off a variety of more user-friendly dashboards and microsites. The Metro Region Explorer lets you quickly view demographic data about the city. Below I asked it to show me where the foreign-born population (dark blue) lived.
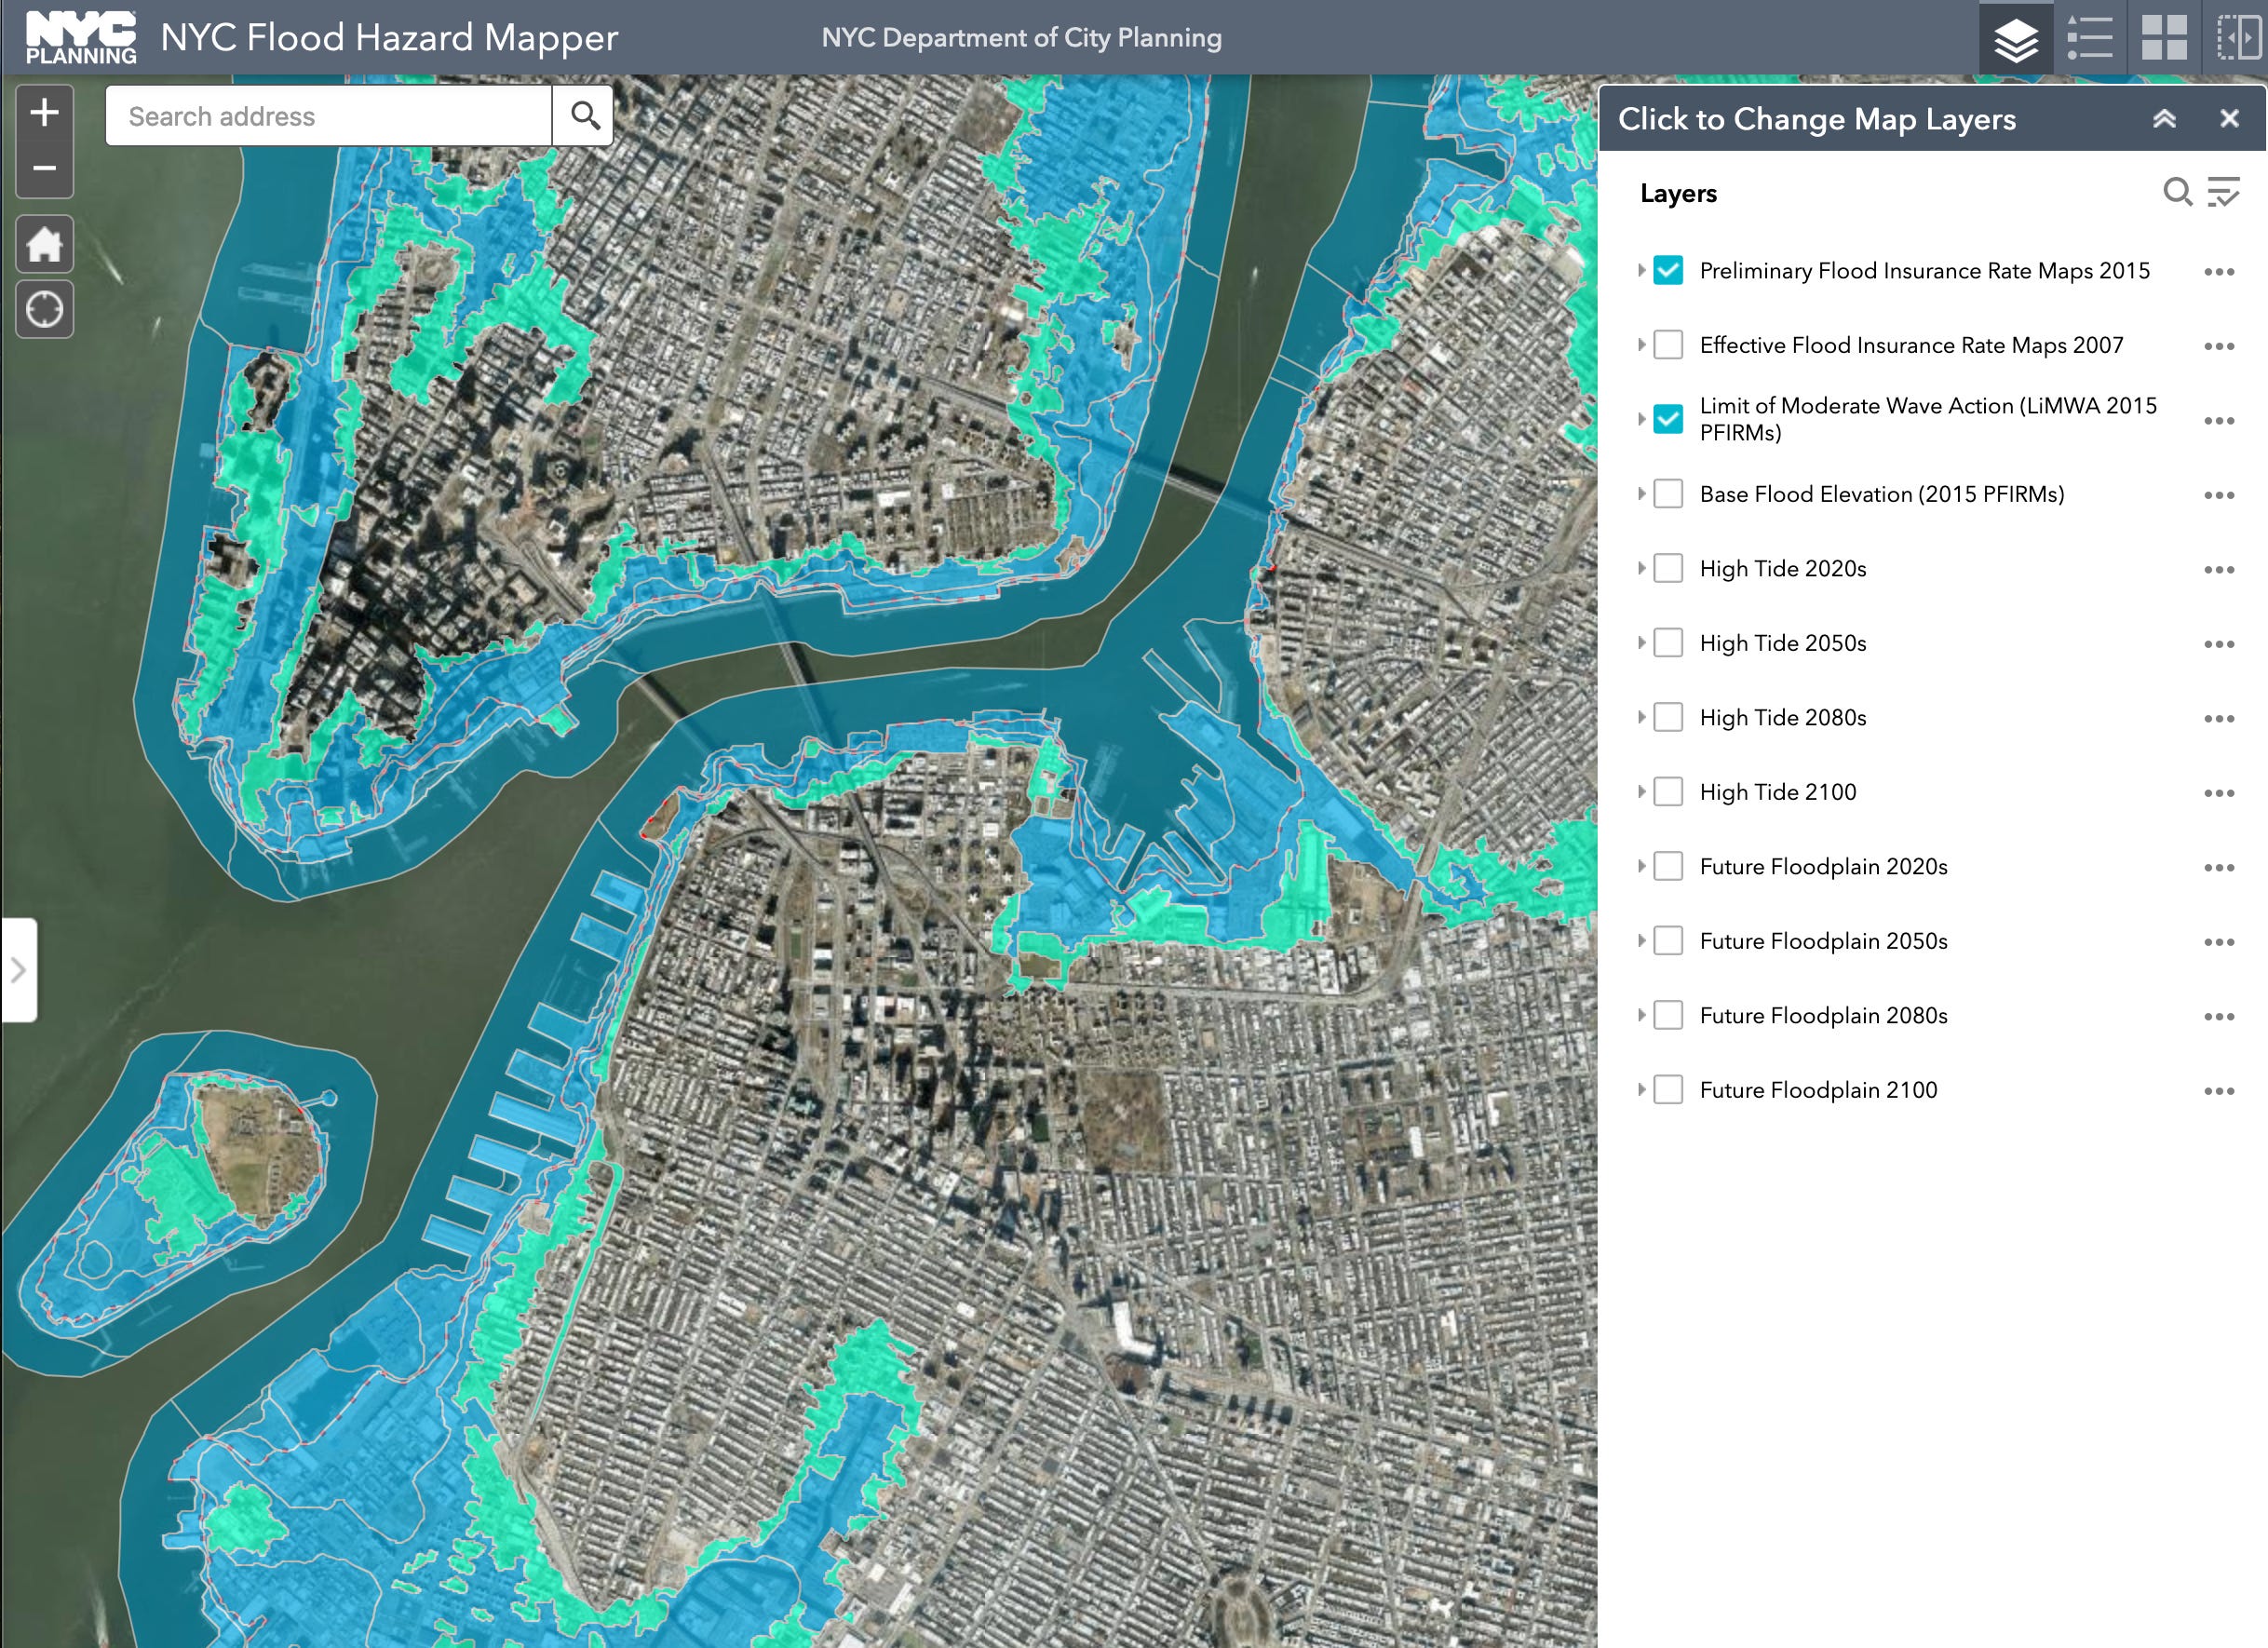
Here is a similar product the city puts out for people to explore flood risks.
Many cities run similar services, but I think NYC has one of the best. There is a surprising amount of data at your fingertips, but we’re not interested in people or flooding right now. Let’s look at the dogs. I nearly crashed my computer when downloading the registry, which has info for about 650,000 dogs. After editing the file to only dog licenses issued from 2017 on, I could have a poke around. I decided to focus on one breed (or family of breeds I guess), the Doodles. These dogs spawned perhaps the greatest New York Times headline of all time.

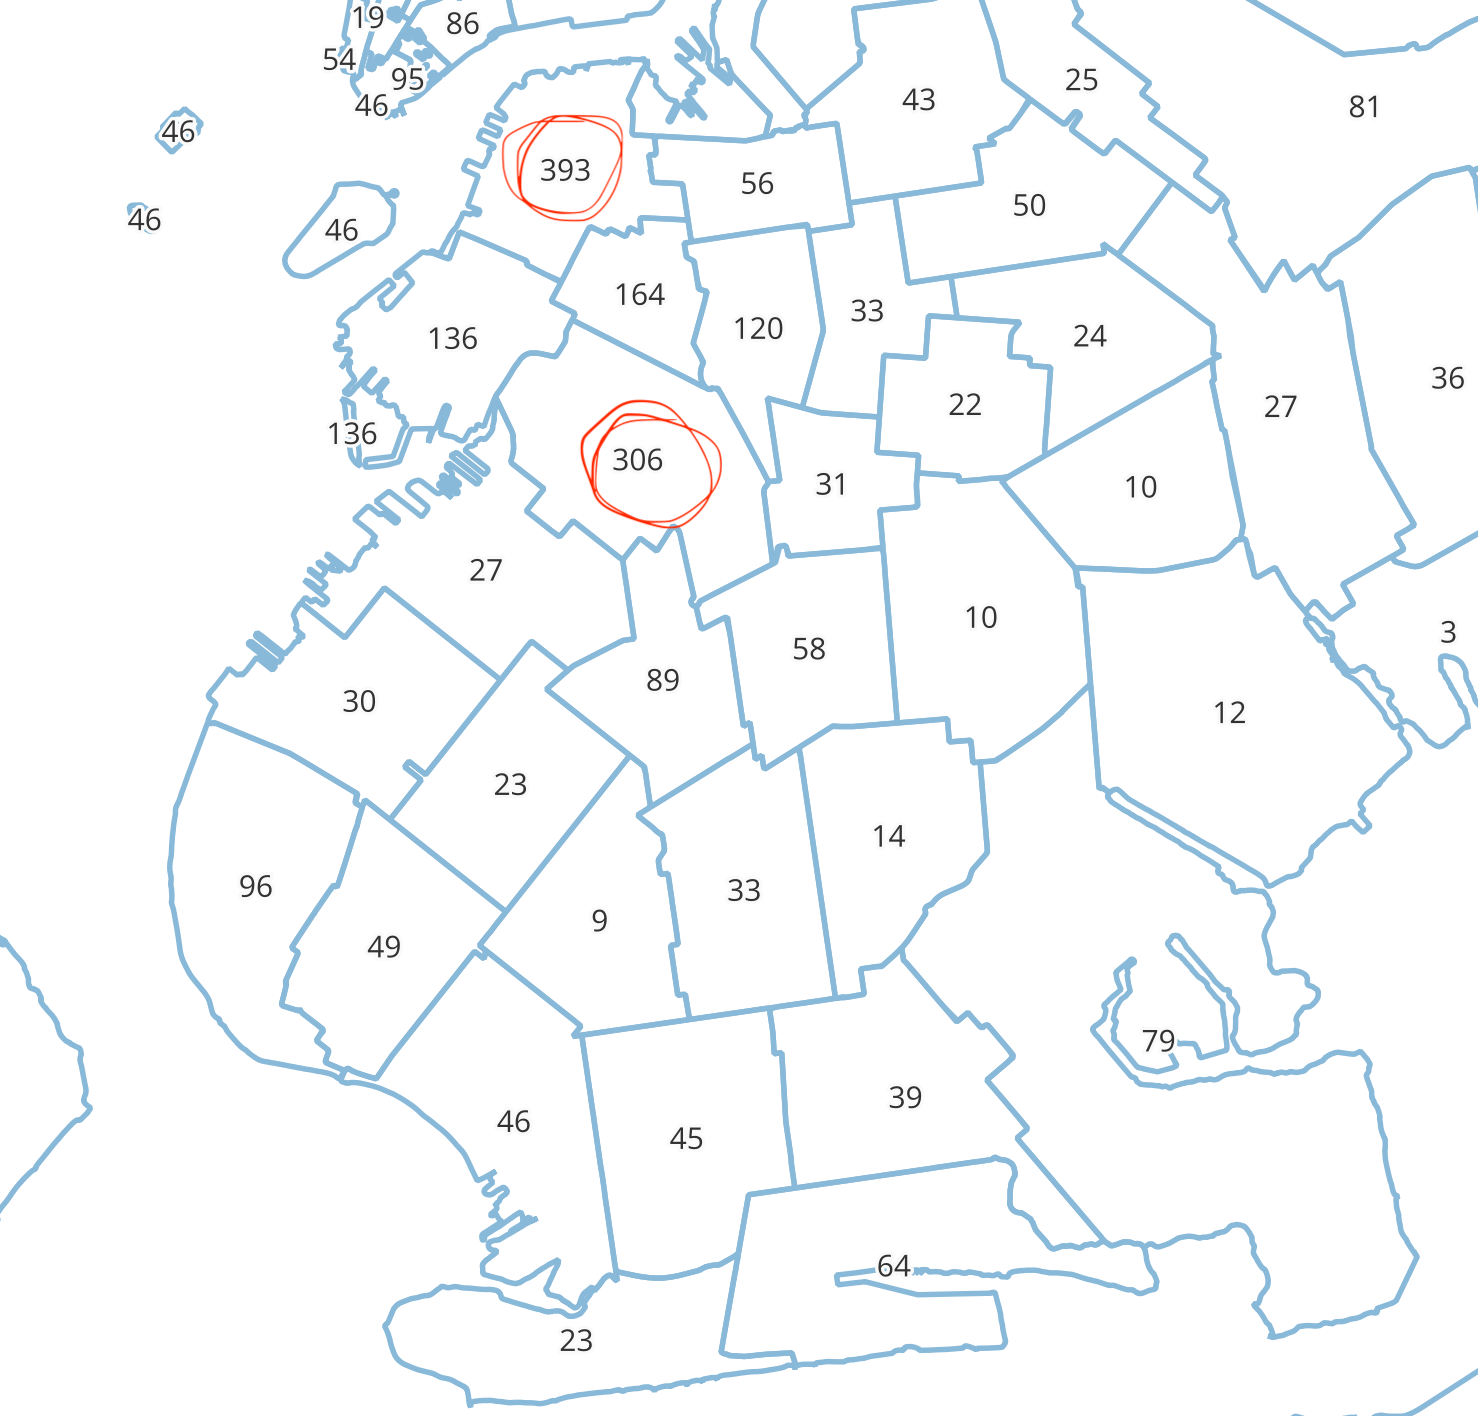
A quick query reveals 12k various “Doodles” registered since 2017. The overwhelming majority of these are Goldendoodles and Labradoodles, and the only totally unique Doodle type in the city is apparently a Yorkidoodle named Godiva in Riverdale. I wanted to see the distribution of Doodles around the city so I counted the amount of Doodles per zip code and created a quick map with the data using the free mapping software QGIS. You can see the results for Brooklyn below. It’s an ugly map lacking any context but shows that by far the two zip codes with the highest number of doodles in Brooklyn are two covering roughly the areas around Brooklyn Heights/Cobble Hill and Park Slope/Windsor Terrace.
Looking at these zip codes’ demographic data using the US Census website, the first thing that stands out is… money. The median household income is $163,310 and $173,889 respectively, more than double the city-wide median income of $78k. So there you have it, my Barnes theory is right, trendy designer dogs like Doodles cluster in rich neighborhoods *bangs gavel.
But wait. By this logic we should see elevated doodle levels in other rich neighborhoods. But we don’t. The median household income in the West Village/Northern Tribeca is $145k but there are only* 220 registered Doodles in this Zip Code. We can’t definitively say that income alone determines Doodle distribution. Let’s layer in some geography and see what we can find out.
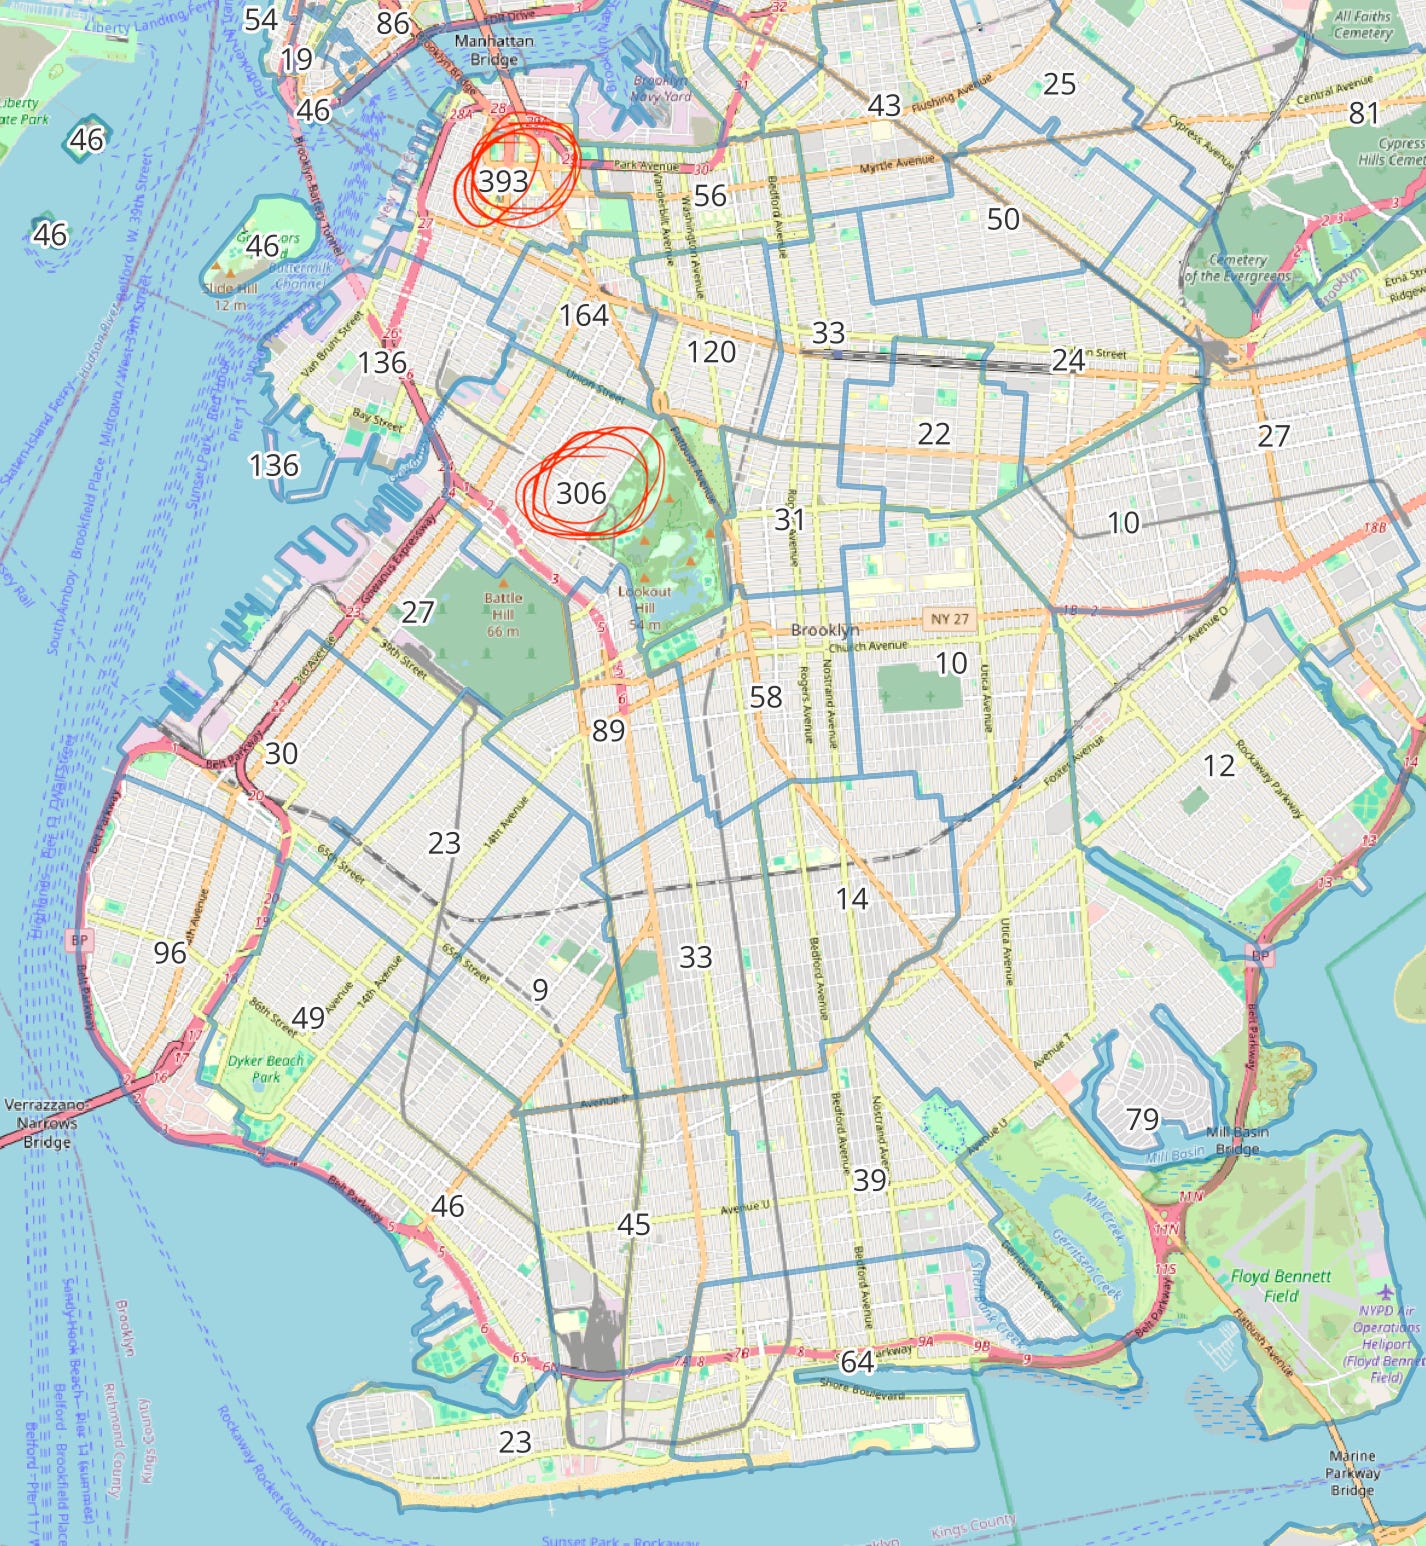
If we look at our two Brooklyn hotspots, we now see these neighborhoods have excellent access to greenspace with Brooklyn Bridge Park and Prospect Park respectively. Could we hypothesize that proximity to a major park and room to run around is related to Doodle ownership? Let’s swing around to another park-heavy area. Here is the area around Central Park.
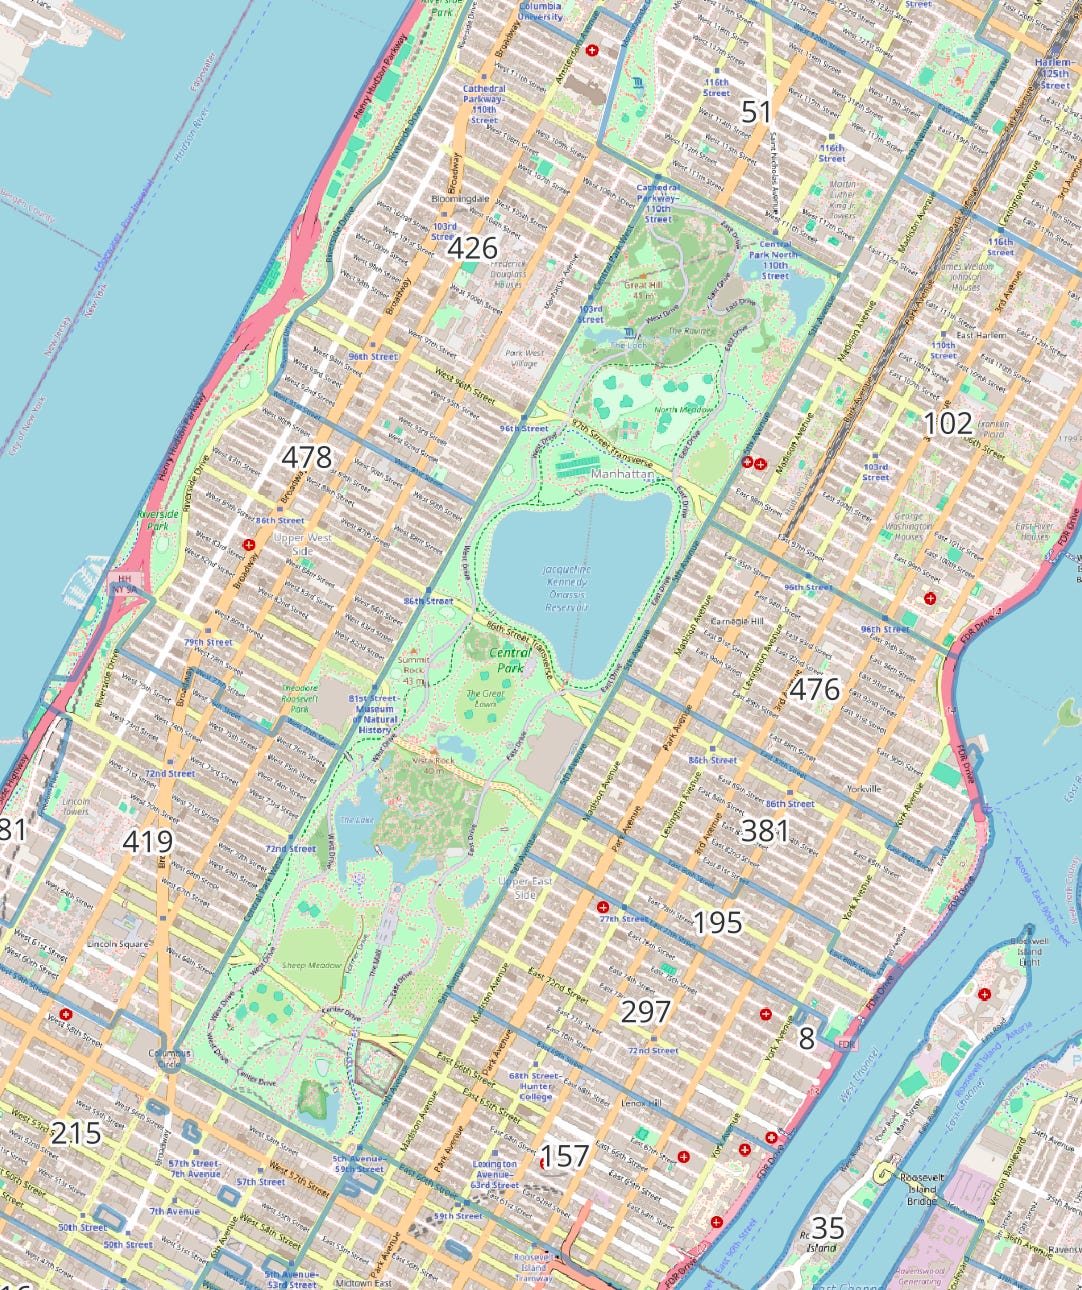
Absolutely massive Doodle numbers. The Upper West Side especially is flush with Doodles, which makes sense given it is sandwiched between Central Park and Riverside Park. We can hypothesize that both income and access to greenspace are probably determining factors in Doodle levels.
What I’m taking you through is an incredibly rudimentary and poorly done version of how planners use data to query, explain, and predict urban phenomena. Cities collect massive amounts of information and, as the dog example shows, a lot of this information comes from your bureaucratic interactions with the City such as registering for licenses and filling out forms. A lot of it also comes from simple counting. When you swipe in and out of the subway your swipes are being monitored by the MTA which tracks activity in and out of its system and may allocate resources and capital investment to busier stations. Traffic sensors count the number of cars, bikes, and increasingly even pedestrians passing a given point. The Dept of Transportation has put displays for some of these sensors around bike lanes across the city so the average person can see them. This data is also used by the Department to gauge demand, and by bike advocates as evidence of the need for bike infrastructure improvements.
 / X")
The dog example also shows the importance of spatial data - the lines, points, rasters, and polygons that allow information to be charted and analyzed in space and combined with numbers to paint a richer picture. We could have run an entire analysis on dogs with just the Doodles-per-zip code and census information from each zip code, but it wasn’t until we put it on a map that the greenspace adjacency became clear.
The open data movement encourages municipalities to publish the vast amounts of information they collect for public use. Cities are incentivized to get as many eyes as possible on this information, for transparency purposes and so non-government actors can plan with it. A library administrator may be interested in the languages spoken in a given neighborhood or the average age and number of children per household so they can plan their branch programming accordingly. When we layer on data within a specific geography we get a rich picture of the place. The landscape architect Ian McHarg pioneered a “layer cake” approach to understanding a site, where he would build up layer after layer of environmental data in an attempt to perfectly place a project.
![Mapping complexity. Our studio instructor posed a question… | by Anna Cich | [Different] Landscapes | Medium](https://substackcdn.com/image/fetch/f_auto,q_auto:good,fl_progressive:steep/https%3A%2F%2Fsubstack-post-media.s3.amazonaws.com%2Fpublic%2Fimages%2Fb33920dd-7f67-4ad6-aa9b-8d4db8183e43_850x1022.jpeg "Mapping complexity. Our studio instructor posed a question… | by Anna Cich | [Different] Landscapes | Medium")
To get theoretical for a second, all the numbers, mapping, and layering I’m talking about is a way to “see” a city, and increasingly the way we trust most. If I told you X neighborhood was rich because it “looked” expensive you might trust me or you might find that to be a subjective opinion. But If I told you it had a high median income and the average household was college-educated with a life expectancy two years above the city average you would probably believe me. We value the quantitative over the qualitative. Numbers and statistics feel “real.” Inquiry that used to rely on observation and field research is now possible from a computer database.
What are the implications of increasingly relying on data to understand places? Greater precision is one, and greater efficiency in pulling together many bits of information. If I want to put a school somewhere I can relatively quickly triangulate all the relevant factors, the number of children in the area, suitable lots for building, transit nodes, and street networks. Imagine McHarg’s layer cake extended infinitely. Another implication is measurement. Numbers go up and down, making it easy to see the “results” of a particular change. This fact is especially why I think governments and planners tend to really enjoy numbers. They feel they can prove an urban intervention “worked” based on them. Micahel Dumas writes that “qualitative research [ aka not numbers] in particular is often deemed less relevant (if not irrelevant) because it does not provide prescriptions for best practices or claim to offer ‘proof.’”
To quote a Scottish proverb, “You don’t make a sheep fatter by measuring it.” Data frivolousness is one side-effect of a world that increasingly only trusts numbers with the proliferation of expensive studies, apps, and sensors. But my concern is the gradual degrading of human understanding and experience as a way of seeing places. I’ve worked on more planning projects in places I’ve never been to than I’m proud to admit, partially because we believed that analytics is a sufficient way to understand a place. Even in my dog example… if you’ve seen a labradoodle before you know these are huge energetic dogs that like to run around. Someone speaking to dog owners or simply observing a local park may have been able to draw many of the conclusions I did with the census and dog license registry. Using your eyes rather than a map or dataset to look at a place, and words to describe it results in nuance, interpretation, and thick descriptions. Many of the most impactful ideas of urbanism, from Jane Jacobs to Jan Gehl, have been developed with careful observation, interviewing, and good writing. These accounts don’t reduce the complexity of the places they describe, they actually revel in the complexity and nuance of them — and sometimes you need to paint a complicated picture.
We are dealing with a real example of this need right now. As politicians and the MTA like to tell us, crime in New York City’s subway is statistically down compared to previous years. Yet survey after survey shows we feel less safe on trains than in the past. Where is the disconnect? Part of it is that while crime may be down, the crime we do have has been… sensational to say the least. But the real reason is that while crimes are quantifiable the things that cause us to feel unsafe may not be. Some weeks back I saw a mentally ill man swinging his arms in the air on the platform, causing obvious unease to the people around him. He didn’t harm anyone and didn’t commit any crime, so this moment appears in no data. But, it was clearly contributing to people’s fears. Understanding why people are avoiding the subway and the roots of their fears requires us to go beyond what we can measure. Data lacks the nuance to describe it. On some level, politicians know this (that’s why they deployed the Army into the trains recently as a ‘show of force’.. the American way!), but there are plenty of voices that tell us it’s really not that bad by pointing to… the data.
Google Maps can tell you the quickest point from A to B, but it can’t (yet) tell you the nicest route, or the route that goes by your kids’ favorite ice cream store, or the route that avoids a place you feel unsafe. In planning, you can do amazing things with data. When it’s made public it’s good not just for libraries and transit advocates, but everyone from artists, to normal people trying to find out if their apartment is rent-controlled. The point isn’t to say which form of seeing a city, qualitative or quantitative, is better or worse, it’s to consider what kind of information we actually want and make sure we’re keeping a balance between the two.
Hey, New York City, hire this guy to fix everything! ("But my concern is the gradual degrading of human understanding and experience as a way of seeing places."!!!)
I would guess that doodle ownership also correlates with having kids. But what strikes me in this piece, but isn't mentioned, is the way data might involve stereotyping because we don't gather data without our own biases (individual or collective), coming in to play. Can data ever really be "pure?"